Same microgram count, different smoke. Here is what the evidence says.
Wildfire and traffic PM2.5 can show the same monitor reading. Evidence suggests they do not cause identical harm, but no study provides a universal multiplier.
Evidence snapshot
Structured synthesis, not a systematic review or a numerical score.
- Grade
- Moderate
- Sources assessed
- 6
- Evidence base
- 2 human studies · 2 lab studies · 2 reviews
- Reviewed through
- July 21, 2026
What we think: the evidence leans toward wildfire PM2.5 producing more respiratory harm per microgram than the mixed-source PM2.5 that ambient air quality standards were built around. One region-specific study found a noticeably larger hospitalization association for wildfire smoke than for non-wildfire pollution at the same concentration, and separate laboratory work gives a plausible biological reason particle chemistry could differ. That's enough for a Moderate grade. It isn't enough for a multiplier: the human comparison comes from one region, the estimated range is wide, and cardiovascular effects are far less studied than respiratory ones. For background on what PM2.5 particles are and where they come from, see the PM2.5 primer.
What equal mass misses
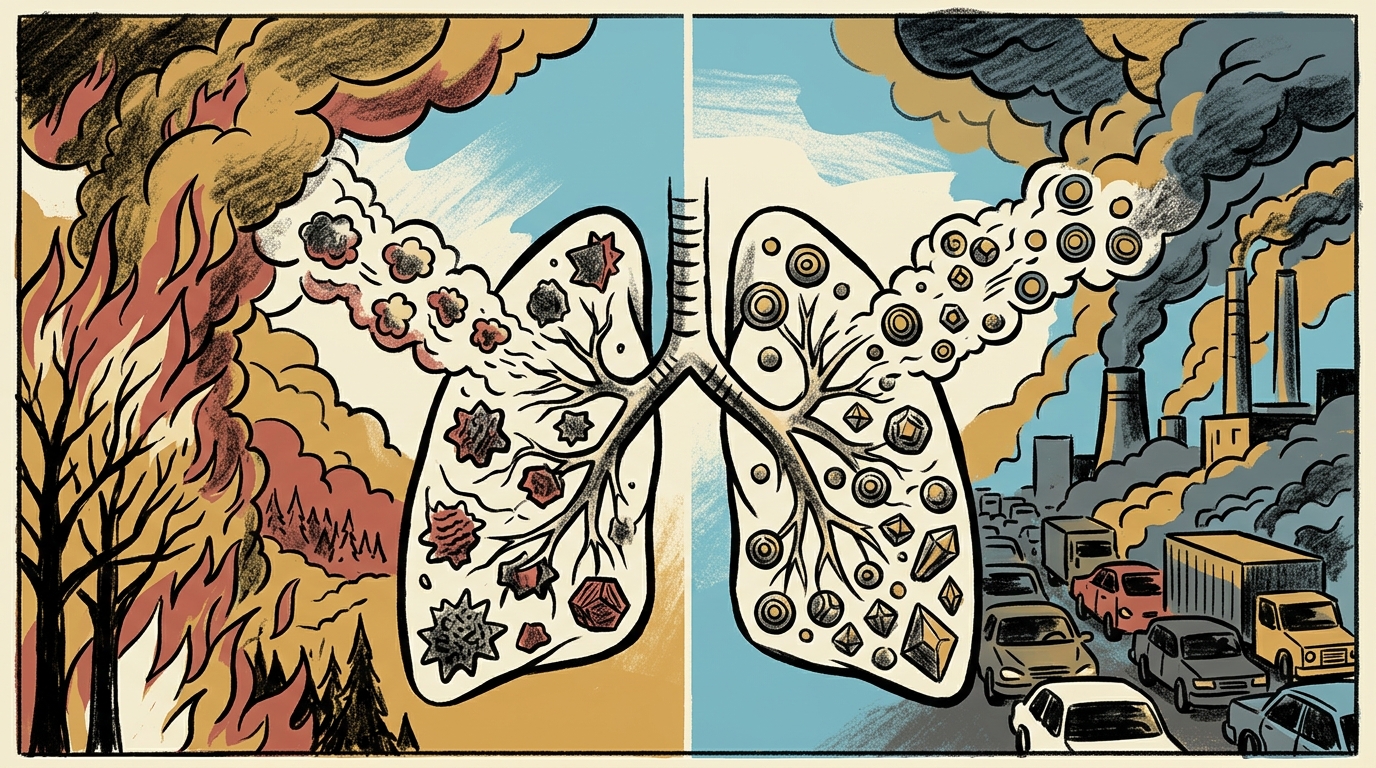
A PM2.5 monitor reports particle mass per cubic meter of air. It says nothing about what those particles are made of. Wildfire smoke and highway exhaust can register the same 35 µg/m³ while carrying different mixes of organic compounds, metals, and combustion byproducts, shaped by what burned, how completely it burned, and how long the plume aged in sunlight before reaching a monitor. Air quality indexes and warning thresholds treat both readings as equivalent. The evidence below asks whether the body does the same.
What the evidence shows, source by source
| Evidence type | Study | Finding | What it can and can't establish |
|---|---|---|---|
| Human, observational | Aguilera et al. 2021, Southern California | A 10 µg/m³ rise in wildfire-specific PM2.5 associated with 1.3%–10% more respiratory hospitalizations, versus 0.67%–1.3% for non-wildfire PM2.5. | Direct comparison in the same population; wide range reflects sensitivity to modeling choices, not a precise multiplier. One region, one set of fire years. |
| Human, observational | Liu et al. 2017, US counties | Wildfire-specific PM2.5 associated with respiratory hospital admissions across a broad geography. | Corroborates that the effect isn't a one-region quirk. Does not run a matched non-wildfire comparison, so it supports direction, not magnitude. |
| Animal toxicology | Wegesser et al. 2009 | Mice exposed to 2008 California wildfire particles showed inflammatory and toxic lung responses. | Shows biological plausibility from one fire's particles in mice. Cannot be scaled into a human risk figure. |
| Cell mechanism | Franzi et al. 2011 | Wildfire-derived particles provoked inflammatory responses in immune cells. | Explains a possible mechanism at the cellular level. No connection to population-level outcomes. |
| Review synthesis | Gould et al. 2024; Reid et al. 2016 | Both describe consistent respiratory harm from wildfire smoke and materially thinner evidence on cardiovascular effects and comparative toxicity. | Neither review treats the comparative question as settled. |
Why one multiplier fails
Four things keep this evidence from collapsing into a single correction factor.
- Fuel and burn intensity vary. Brush, timber, and structures produce different particle chemistry, and how completely each burns changes the mix further.
- Plume age changes the particles. Smoke reacts with sunlight and other pollutants as it travels, so what's measured near a fire isn't necessarily what's measured a day and a hundred miles downwind.
- Exposure is modeled, not assayed. Studies that separate "wildfire" from "non-wildfire" PM2.5 use satellite plume data and statistical decomposition, not a chemical test of what any individual breathed.
- The outcome changes the picture. Respiratory hospitalization is the best-supported effect here. Cardiovascular and longer-term outcomes are comparatively unsettled and shouldn't be assumed to follow the same pattern.
Toxicology gives a plausible reason wildfire particles could be more damaging. Epidemiology shows a real, larger respiratory association in the studies that have looked. Combining a mouse study, a cell study, and one region's hospitalization data into "wildfire smoke is X times worse" would overstate what any single piece of evidence, or all of them together, supports.
Limitations
The direct human comparison (Aguilera) covers one region over a defined set of fire years, not a national sample. The supporting county-level study (Liu) doesn't run the same non-wildfire comparison, so it corroborates direction, not size of effect. Exposure attribution methods carry their own error. The animal and cell studies used particles from specific fires under lab conditions, which doesn't capture how variable wildfire smoke is from one fire to the next. Cardiovascular and mortality comparisons between wildfire and ambient PM2.5 are notably thinner than the respiratory findings summarized here.
How to use the finding
Treat a wildfire smoke reading as at least as serious as an ambient pollution reading at the same concentration, with more caution rather than less for anyone with asthma, heart disease, or respiratory sensitivity. Don't discount a wildfire day because the source is smoke rather than traffic or industry. And don't apply a fixed multiplier to a wildfire reading before deciding how to act; the evidence supports a larger respiratory association, not a specific number you can plug into any fire, anywhere. Plan around the measured concentration in front of you, adjusted toward caution when the source is a fire.